This page serves as a central hub for all the interactive data reports created by the Department of Analysis, Applications, and Institutional Research. These reports have been generated in Power BI, Microsoft’s interactive data visualization and analytics tool. They cover key metrics and insights relevant to USM operations.
We hope you find these reports useful and insightful. If you have any questions or need assistance, please do not hesitate to contact the Department of Analysis, Applications, and Institutional Research.
Public Reports
Reports based on census data
| Report Name | Description | Updated Schedule |
|---|---|---|
| Undergraduate Retention/Graduation Reports – IPEDS (Blue Report) | Cohorts by College, School, Plan, and Subplan For a detailed description of the Blue vs. the Yellow Reports, please see our definitions. | Fall: 10/15 Spring: 02/15 |
| Retention and Time to Degree Report (Yellow Report) | Cohorts by College, School, and Plan For a detailed description of the Blue vs. the Yellow Reports, please see our definitions. | Fall: 10/15 Spring: 02/15 |
| Retention Charts – Term 2 and Year 2 | IPEDS Cohorts by College | Fall: 10/15 Spring: 02/15 |
| Adult Learner Initiative (ALI) | Adult Learner Retention by Age | Fall: 10/15 Spring: 02/15 |
| Report Name | Description | Update Schedule |
|---|---|---|
| Power BI Factbook pages | The most frequently accessed pages of the Factbook | Fall: 10/15 Spring: 02/15 Summer: 08/15 |
| Report Name | Description | Update Schedule |
|---|---|---|
| Location Description Report by HC, FTE, and SCH | By: Career, Course Level, College, USMDept, Subject, Location or Inter-institutional Cross Listed (IICL) | Fall: 10/15 Spring: 02/15 Summer: 08/15 |
| Report Name | Description | Update Schedule |
|---|---|---|
| Course Enrollments and SCH | By: Career, Course Level, College, USMDept, Subject, Location or Inter-institutional Cross Listed (IICL) | Fall: 10/15 Spring: 02/15 Summer: 08/15 |
Internal Reports
Combination of census and transactional data
| Report Name | Description | Last Updated |
|---|---|---|
| Retention – Academic Action | IPEDS-based retention report of students with Academic Actions and probationary status | 12/10/2024 |
| Retention – Change of Major | IPEDS-based retention report of students who changed majors | 05/31/2023 |
| Retention – Dean’s List | IPEDS-based retention report of Dean’s List students | 12/10/2024 |
| Retention – DM Honors Russell | IPEDS-based retention report of students in Double Majors, Honors, and Russell Scholars programs | 10/07/2022 |
| Retention – Honors | IPEDS-based retention report of students in the Honors program | 02/06/2024 |
| Retention – Incomplete | IPEDS-based retention report of students with lapsed, removed, and incomplete status | 12/10/2024 |
| Retention – Late Admits – Low HS GPA | IPEDS-based retention report of students by matriculation time and high school GPA | 08/26/2024 |
| Retention – Lunder Scholarship | IPEDS-based retention report of students who received the Lunder Scholarship | 06/26/2024 |
| Retention – Maine HS CEEB | IPEDS-based retention report of students by Maine high school | 02/07/2024 |
| Retention – NA Waiver & NA Agreement | IPEDS-based retention report of students receiving the Native American Waiver or included in the Native American Agreement | 02/13/2026 |
| Retention – Pell_TRIO_STEM | IPEDS-based retention report of Pell and TRIO students by STEM status | 12/10/2024 |
| Retention – Research Learning Courses | IPEDS-based retention report of students enrolled in research lerning classes | 05/01/2024 |
| Retention – Russell Scholars | IPEDS-based retention report of students enrolled in the Russell Scholars program | 06/06/2024 |
| Retention – TRIO TRIS JMG | IPEDS-based retention report of students in the TRIO, TRIS, or JMG student groups | 05/31/2023 |
| Retention – Undeclared | IPEDS-based retention report of students with an undeclared major | 05/31/2023 |
| Retention – USM Grants | IPEDS-based retention report of students receiving a USM grant | 02/24/2024 |
| Retention – CAHS | IPEDS-based retention report of CAHS students including multiple charts | 05/31/2023 |
| RetentionAttritionReport | IPEDS-based retention and attrition report | 11/28/2022 |
| RetentionAttritionReport – DMs | IPEDS-based retention and attrition report of students with a double major | 10/04/2022 |
| Retention – Worthington | IPEDS-based retention report of students receiving the Worhtington Scholarship | 10/11/2023 |
| Report Name | Description | Last Updated |
|---|---|---|
| Advising – ACS / Continuing Student Reports | ACS appointment totals by advisor, month, status, major | 6/9/25 |
| Active Degree Students – First Choice Major | First choice major / current major totals, cumulative GPA | 1/29/23 |
| Admissions – Early College filter | Admissions – Early College students applying/admitted/matriculated enrolled at USM, non-yield – subsequent college of enrollment | 08/10/24 |
| Canceled Course Sections | Fall 2020-2024 course section cancellations subject / catalog number / course section | 01/23/25 |
| Change of Major Headcount | Previous / new major totals by admit type, term, residency, academic level, cumulative credit hour range, academic year | 11/07/25 |
| Course /Student Enrollment Report as of Census – Filter by Core Curriculum type(s) | Headcount / Enrolled / Credit Hours totals as of census with Core Curriculum requirements filter by course section | 12/15/25 |
| Degrees Conferred by Compl. Term – USM Course, Transfer, Test and Other Credit History – End of Term | Provides five years worth of USM course, transfer, test and other credit history of undergraduate and graduate students whose degrees have been conferred with a completion term between 2021-2025 (Health Sciences is the plan selected by default). Fall 2025 data will be added to the report after the semester has ended. | 12/04/25 |
| Enrolled multiple colleges as of Fall Census | Undergraduate students as of census concurrently enrolled at another institution (external enrollment pulled from National Student Clearinghouse) | 11/23/24 |
| Enrollment and Persistence Gap Analysis | Identifies and quantifies transition points where potential and current students disengage from the institution. By cross-referencing internal admissions and enrollment data with National Student Clearinghouse (NSC) records, the report evaluates two primary cohorts: Non-Enrolled Applicants (those who applied but did not enroll) and Non-Persisting Students (continuing students who did not return for the subsequent semester). | 02/11/26 |
| ESL-ELB Reports | Non-degree students enrolled in ESL courses(s) who later matriculated into Title IV eligible degree program ELB student enrolled by admit term – most recent major | 08/16/24 |
| GPACU Course Metrics | Greater Portland Alliance of College and University HC / SCH by course | 12/11/24 |
| Learning Assistant Profile | Retention, course sequence analysis of Learning Assistants, students in courses with Learning Assistants | 02/13/25 |
| Non Enrolled Admits Transfer Credit Hour and Average totals | Accepted transfer credit hour totals / accepted transfer credit hour averages of 2019-2023 undergraduate admits awarded transfer credit (all model statuses) not enrolled as of census date of admit term | 08/01/24 |
| UGRD Degrees Conferred Credit Hours | Undergraduate financial aid eligible degrees awarded by fiscal year – percent completed by cumulative credit hour range | 08/08/24 |
| UMS Incomplete Grade comparison | Percent of incomplete grades in incomplete/lapsed status | 12/10/24 |
| UMS USM / Transfer Credit Attempted = Concurrent Enrollment Fall 2012- Spring 2022 | Undergraduate degree students attempted transfer credit taken as of term at USM Concurrent enrollment at other UMS Institution | 05/12/23 |
| Undergraduate Students Concurrently Enrolled at Another Institution | Undergraduate students as of census concurrently enrolled at another institution (external enrollment data pulled from National Student Clearinghouse) | 11/23/24 |
| USM Degrees Conferred by Completion Term – Course and Transfer Credit History – End of Term | USM enrollment and transfer credit history by undergraduate and graduate degrees conferred by completion term | 11/26/25 |
| USM Early College Course Enrollment | Early College Course Enrollment | 08/09/24 |
Updated daily between 8:00-8:30 am
| Report Name | Description | Update Schedule |
|---|---|---|
| Undergraduate/Graduate Admission Report | App/admit/matric/enrolled totals | Daily |
| Undergraduate/Graduate Student Enrollment Report | Student headcount/credit hour totals | Daily |
| Undergraduate/Graduate Course Enrollment Report | Course enrolled/credit hour totals | Daily |
| Report Name | Description | Last Updated |
|---|---|---|
| Employee Diversity | Ad Hoc report of donut charts showing instructor sex and ethnicity by program | 07/29/24 |
| Program Review Scatter Charts | Scatter charts comparing HC, SCH, completions, and faculty counts for top-performing programs | 04/17/24 |
| USM Grade Distribution Report | USM Grade Distribution Report created by the system | 02/18/25 |
| HC, SCH, and FTE Equivalent for NA Waiver and NA Agreement students | Headcount, Student Credit Hours, and Full Time Equivalent for Native American Waiver and Native America Agreement students | 02/13/26 |
Navigation Help

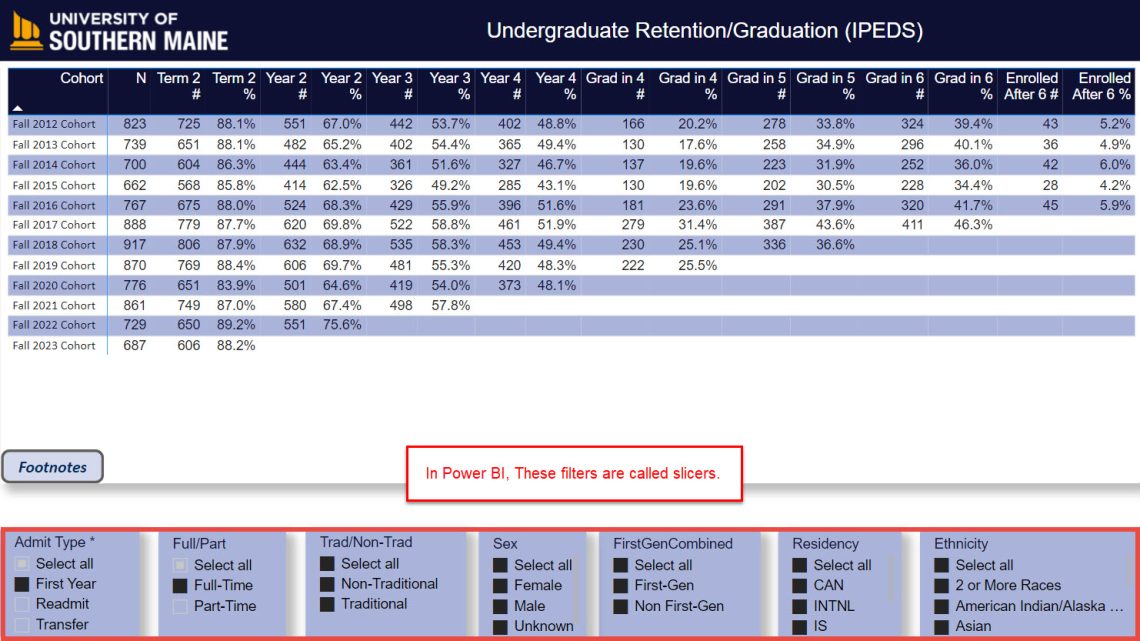
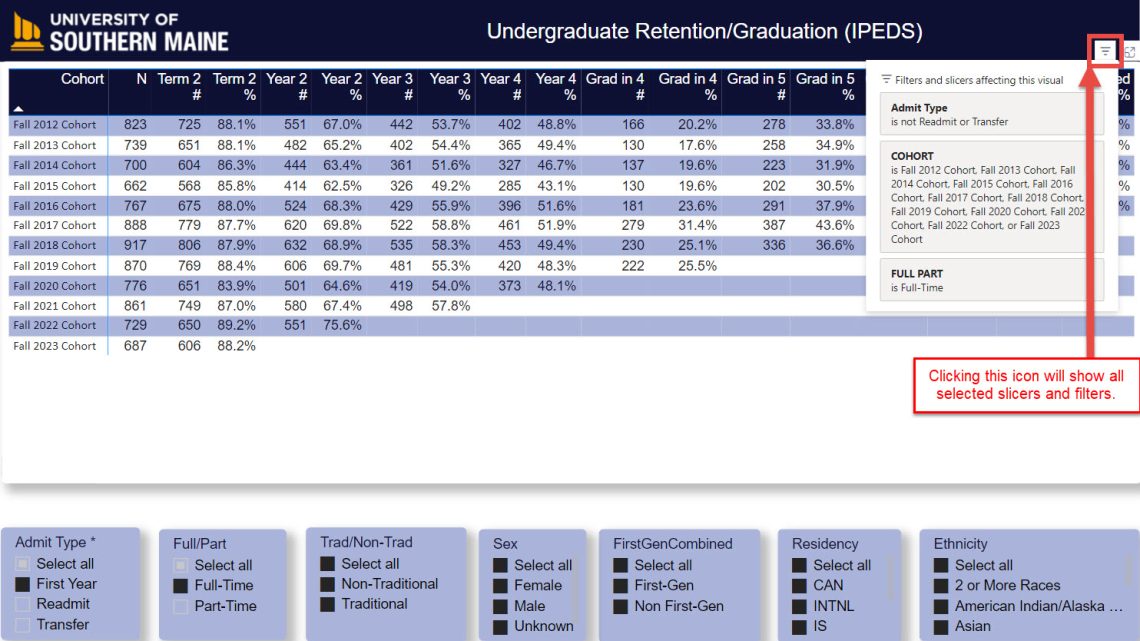
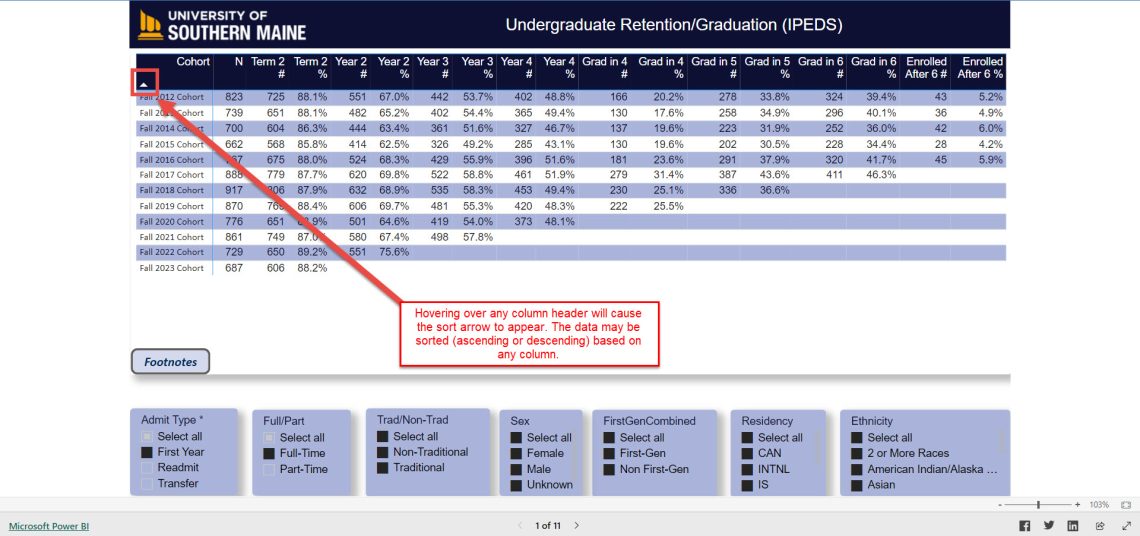
Always note the condition of current slicers. By default, the slicers are set to IPEDS standards: All First Year, Full Time students by cohort. These can be selected and unselected based on specifics needs. Please note that some options will only be visible by scrolling down within a given slicer.
To select more than one option in a slicer, hold CTRL + select on Windows or Command + select on Mac.
To return to default on all slicers, simply reload the web page.


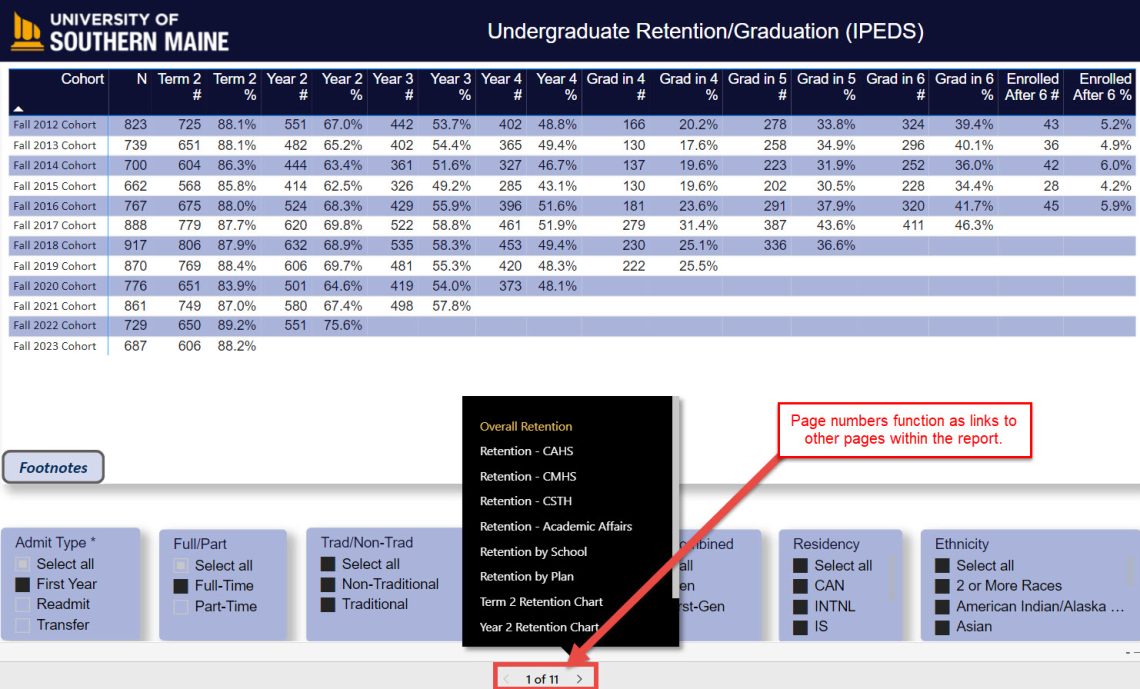
Clicking the page numbers will show a list of pages within the report. The titles in the list also function as links to other pages.


