

Now in Power BI
Please read this first:
We have recently moved our retention reports to an interactive Power BI format. We currently have two public reports which contain all the data of previous reports, plus more.
Undergraduate Retention/Graduation Reports – IPEDS (Blue Report)
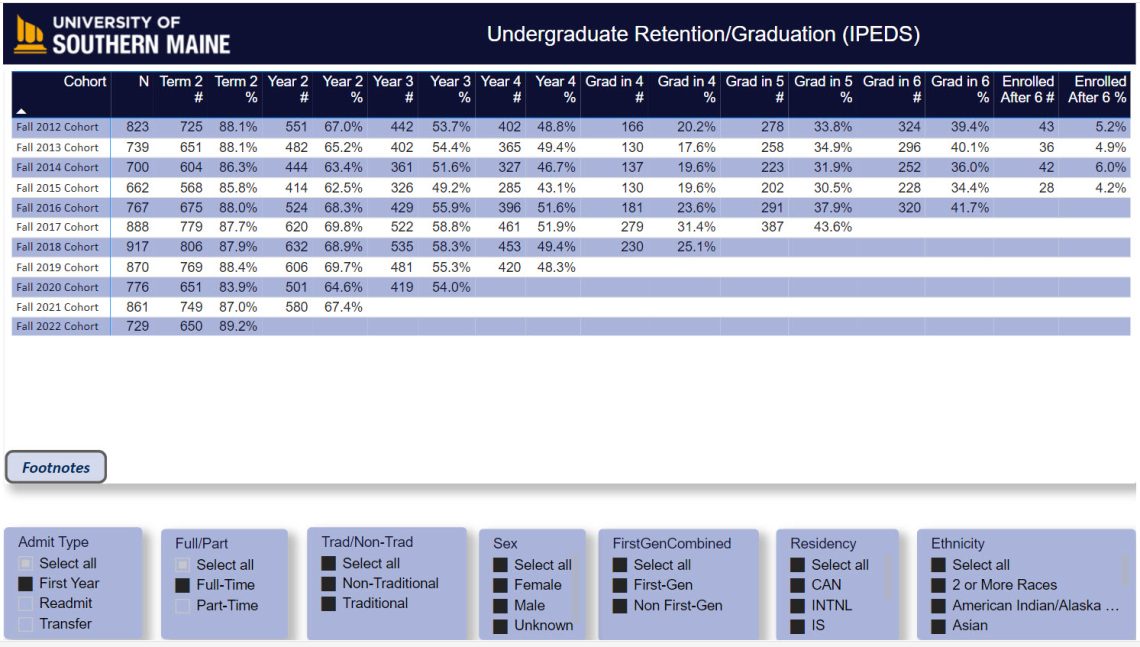
- Overall (page 1 of 11
- College of Arts, Humanities, and Social Sciences (page 2 of 11
- College of Management and Human Services (page 3 of 11)
- College of Science, Technology, and Health (page 4 of 11)
- College of Academic Affairs (page 5 of 11)
- By School (Page 6 of 11)
- By Plan (Page 7 of 11)
- Term 2 Chart (page 8 of 11)
- Year 2 Chart (9 of 11)
- By Plan/Subplan (10 of 11)
- Footnotes (11 of 11)
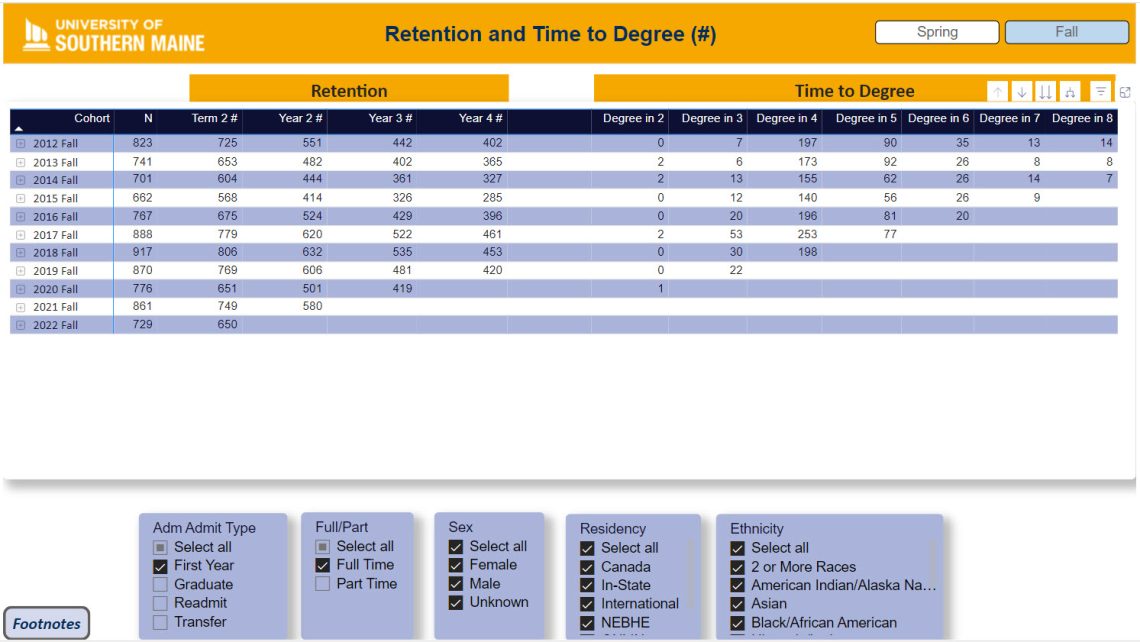
Retention and Time to Degree Report (Yellow Report)
If you are unsure of which report to use please contact the Department of Analysis, Applications, and Institutional Research.
How-To Documents
- How to print Power BI Reports using your web browser
- Print Power BI output using your web browser
- (Most recent version of Overall UGRD pdf Quick Link)