Treasure maps are the stuff of childhood daydreams. The same can’t be said for maps that chart student loan debt. But as teaching tools, they’re invaluable and surprisingly fun considering the weighty subject matter.
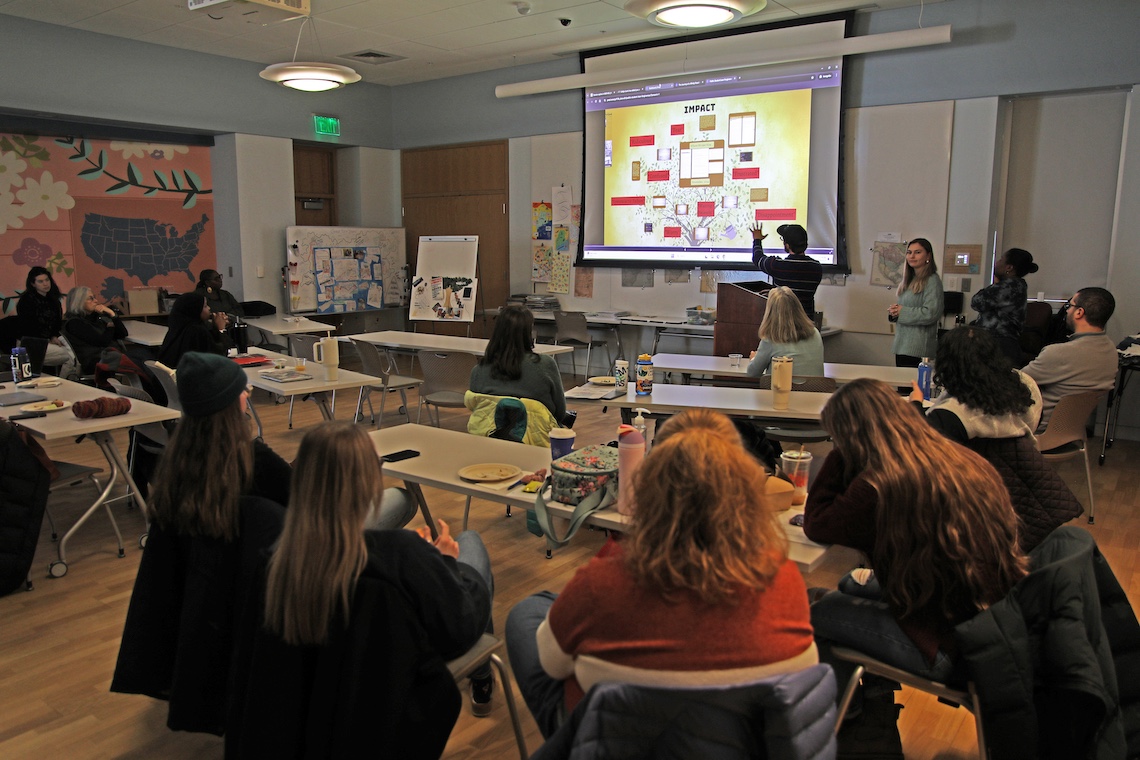
The mapmakers are graduate students in the Social Work program at the University of Southern Maine. They spent the fall semester creating their maps for a class in Social Welfare Policy, taught by Dr. Paula Gerstenblatt. The project culminated in a presentation at the Osher Map Library in Portland on December 10.
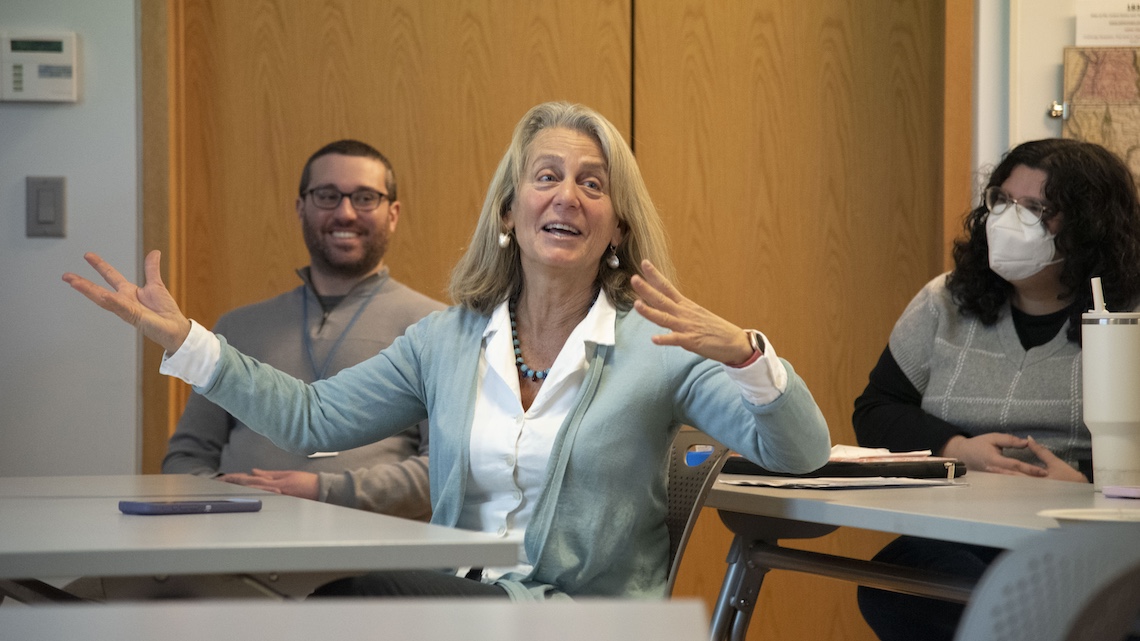
“It pushes them to creatively think, which is an important skill, especially in social work,” Gerstenblatt said. “You’ve got to do creative problem solving, you’ve got to pivot, you’ve got to regroup.”
Gerstenblatt assigned her students to use mapmaking skills to illustrate the causes and consequences of student loan debt. According to the Federal Reserve, Americans owe more than $1.7 trillion in borrowed money and interest for post-secondary education.
The class divided in four groups, each focused on a different aspect of the larger issue. The research was intensive. Students mined historical data from USM’s Glickman Library, including both general circulation and the Special Collections wing.
The Osher Map Library offered more information, as well as inspiration for the look of the projects. The maps in its collection range from traditional navigation tools to headier offerings that use visual cues to make sense of complex ideas.

The four maps that students produced varied widely in appearance. The first group to present made a collage of newspapers clippings, overlayed with handwritten arrows and notes to reorient the daily reporting of years ago with the lessons of hindsight.
Another group drew heavily on old yearbooks for its research into the relationship between student loan debt and shifting campus demographics. The result was a map that looked like a yearbook with page after page of student photos spanning the past several decades.
A tree was the central motif for the third group’s map. Around it roots, they listed the intentions behind key policies that shaped the financial picture for college students. The outcomes of those policies sprouted out of the branches.
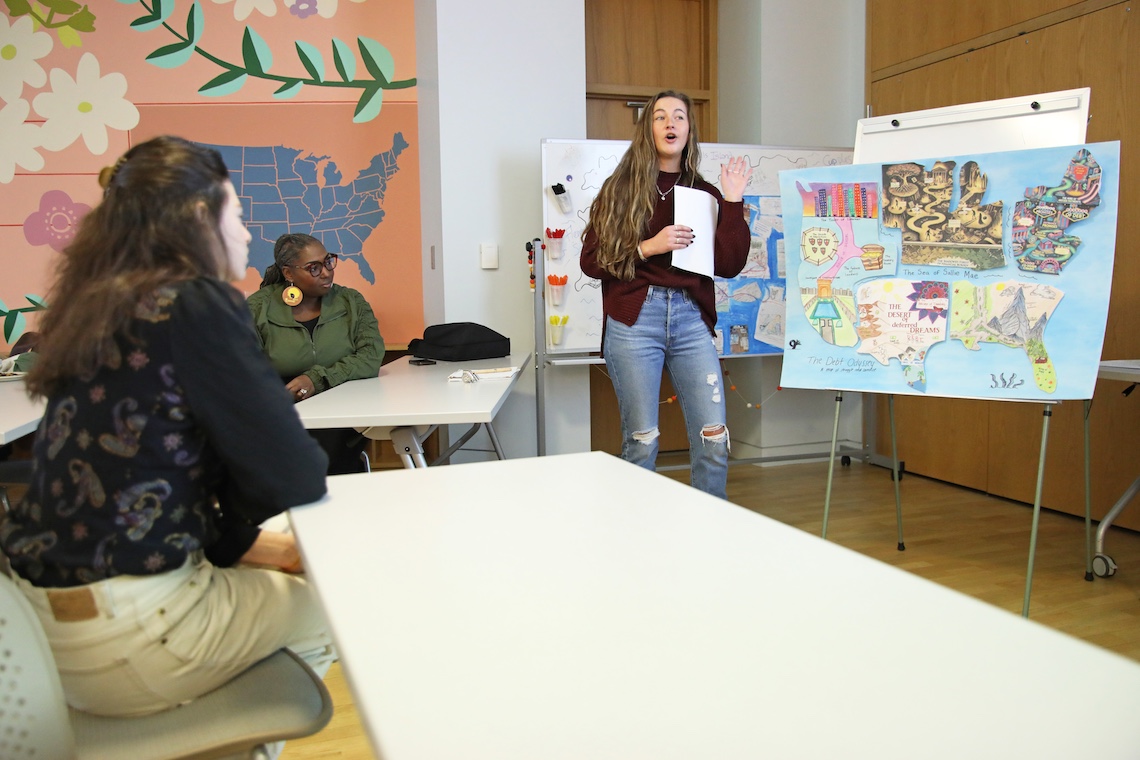
Only one group opted for an allegorical approach. They reimagined the continental United States as a fantasy land. The regional divisions represented different challenges in dealing with private loans.
“I had a lot of fun doing it,” said Ellen Karlberg. “Being able to illustrate something that does have a lot of underlying meaning was super fun for me. And I had fun making it a little silly, a little artistic.”
The west coast was Karlberg’s responsibility. The treasure chests and skyscrapers that she drew into the landscape were loaded with double meaning. The symbolism was the main point, but the art also mattered to her. She took extra time to watch an online tutorial that helped her draw the Courtyard of Creditworthiness in three-dimensional perspective.

Karlberg and her teammates eschewed lengthy captions, letting the map speak for itself. They also documented the full breadth of their research in an accompanying policy brief, as did all the groups.
“We did a ton of reading and looking through articles and looking through the Osher map stuff,” Karlberg said. “It was a whole new learning experience for me, and I thought that I’d already known a lot about maps.”
The research that Gerstenblatt sees from her students tends to be more comprehensive for mapmaking projects than most written reports. She keeps instructions to a minimum and trusts that the creative process will fuel their excitement to learn.
“I don’t want to telegraph their learning. I don’t want to do that,” Gerstenblatt said. “I want to uncap their potential.”

