USM’s Osher Map Library wins state grant for America at 250 lecture series
The University of Southern Maine’s Osher Map Library and Smith Center for Cartographic Education (OML) has been awarded a grant from the Maine Semiquincentennial … Read More


The University of Southern Maine’s Osher Map Library and Smith Center for Cartographic Education (OML) has been awarded a grant from the Maine Semiquincentennial … Read More
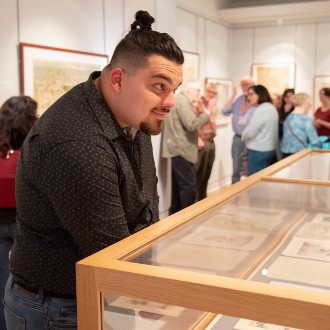
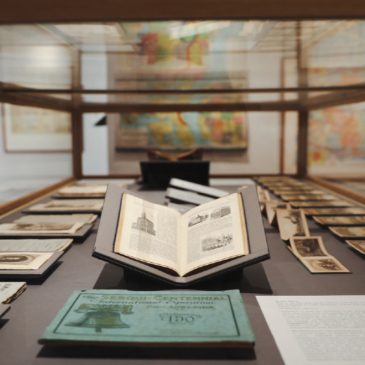
Students in Dr. David Lowry’s Anthropology class curated the exhibition “A World On Display” at the Osher Map Library.
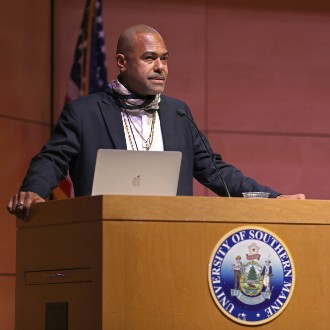
In his speech at the annual DiMatteo Lecture, Billy Gérard Frank explained the artistic process behind his “Indigo: Entanglements” series.

Dr. Matthew Edney, the Osher Professor in the History of Cartography and a faculty member inthe Geography-Anthropology program at the Muskie School of Public Service, … Read More

Frank will discuss his “Indigo: Entanglements” series of paintings and show his 2022 Venice Biennale short film, “Palimpsest: Tales Spun from the Sea and Memory.” This will be the film’s New England premiere.
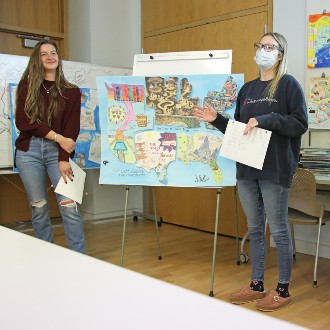
Each of the four maps produced by Dr. Paula Gerstenblatt’s Social Work class used different techniques including collage and allegory to illustrate how student loan debt grew into a national problem.
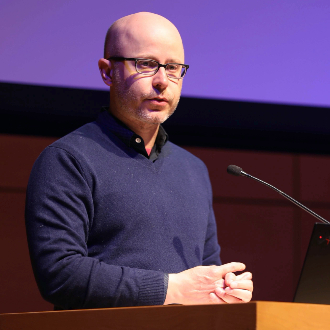
Dr. Bill Rankin talks about the role cartography can play in counteracting us vs. them thinking by recasting borders as a middle ground rather than dividing line between cultures.
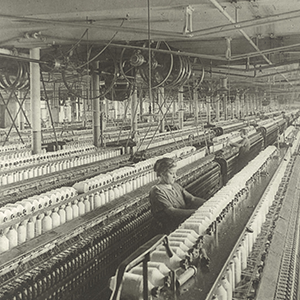
Read the Lewiston Sun Journal’s article featuring the Osher Map Library and Smith Center for Cartographic Education’s textile mill exhibition, “Industry, Wealth, and Labor: Mapping New England’s Textile Industry”.
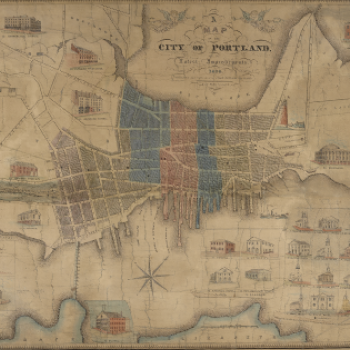
Why did John Cullum make this stunning map of the city of Portland, Maine, in 1836? Listen to the Osher Map Library’s latest podcast with OML Faculty Scholar, Dr. Matthew Edney and Executive Director Dr. Libby Bischof discussing John Cullum’s 1836 Map of Portland, Maine.
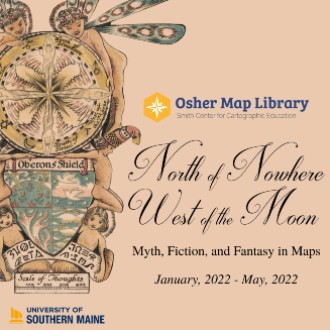
For anyone who’s ever dreamed of following Dorothy over the rainbow or flying to Never Never Land with Peter Pan, an exhibition at the Osher Map Library points the way.